Available tracks#
Quick start#
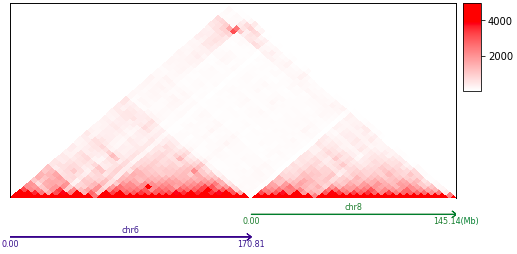
import trackc as tc

ten = tc.tenon(figsize=(8,1))
ten.add(pos='bottom', height=3.6)
ten.add(pos='bottom', height=1)

chr6_len = clr.chromsizes['chr6']
chr8_len = clr.chromsizes['chr8']

mat = tc.tl.extractContactRegions(clr='GSM4417639_SK-N-DZ_C6BC81F2_b38d5.mcool::/resolutions/5120000', row_regions=['chr6', 'chr8'])
tc.pl.mapC(ax=ten.axs(0), mat=mat.cmat, map_type='triangle', maxrange=5000)

tc.pl.multi_scale_track(ax=ten.axs(1), regions=['chr6:0-{0}'.format(chr6_len), 'chr8:0-{0}'.format(chr8_len)],
                        scale_adjust='Mb', intervals=2, tick_rotation=0)
# tc.savefig('hicmap.pdf')
GridSpec#
The visualization of multi-omics data in a genomic region often requires a combination of multiple tracks. To create a publication-ready image, it is crucial to finely adjust the proportions of each track. The ability to quickly adjust the proportions of tracks and easily add or remove them is an important issue.
Trackc provides two methods for drawing layouts.
trackc.tenon
trackc.make_spec
These functions provide users with a fast and flexible way to adjust the proportions of each track, as well as conveniently add and remove tracks in the multi-omics visualization layout.
trackc.tenon returns an object, for example, ten = trackc.tenon(width=5, height=1). In this case, ten` is an object that represents a virtual figure with a width of 5 and a height of 1. Users can use the ten.add(pos=’bottom’, height=4, hspace=0.1) method to add tracks to this figure. The height` parameter represents the relative height of the newly added track compared to the virtual figure. For example, if the virtual figure has a height of 1 and the new track has a height of 4, the actual height of the subplot will be 1 * 4. Using the ten.add method is similar to building with blocks. The pos` parameter allows users to choose whether to add a new track at the top or bottom. The “hspace=0.1” parameter controls the spacing between the newly added track and the adjacent tracks.
trackc.make_spec defines the size of the entire picture, allowing users to set a set of subimages from top-to-bottom or from left-to-right, which can be accounted for by height_ratios or width_ratios.
Available Tracks#
This section contains various quick tutorials showcasing omics data visualization with trackc.
Available Track Types: