Calculating insulation score#
test data#
HFF_MicroC.mcool: https://files.osf.io/v1/resources/hjcxg/providers/osfstorage/5f73756d9e9a3d03ec6e3922?action=download&direct&version=1
[2]:
import cooler
from cooltools import insulation
[4]:
resolution = 10000
coolfile = f"./HFF_MicroC.mcool::resolutions/{resolution}"
clr = cooler.Cooler(coolfile)
windows = [3 * resolution, 5 * resolution, 10 * resolution, 25 * resolution]
insulation_table = insulation(clr, windows, verbose=True)
INFO:root:Processing region chr2
INFO:root:Processing region chr17
[5]:
display(insulation_table.head(5))
| chrom | start | end | region | is_bad_bin | log2_insulation_score_30000 | n_valid_pixels_30000 | log2_insulation_score_50000 | n_valid_pixels_50000 | log2_insulation_score_100000 | ... | log2_insulation_score_250000 | n_valid_pixels_250000 | boundary_strength_30000 | boundary_strength_50000 | boundary_strength_250000 | boundary_strength_100000 | is_boundary_30000 | is_boundary_50000 | is_boundary_100000 | is_boundary_250000 | |
|---|---|---|---|---|---|---|---|---|---|---|---|---|---|---|---|---|---|---|---|---|---|
| 0 | chr2 | 0 | 10000 | chr2 | True | NaN | 0.0 | NaN | 0.0 | NaN | ... | NaN | 0.0 | NaN | NaN | NaN | NaN | False | False | False | False |
| 1 | chr2 | 10000 | 20000 | chr2 | False | 0.431607 | 1.0 | 0.507928 | 3.0 | 0.682245 | ... | 1.318723 | 23.0 | NaN | NaN | NaN | NaN | False | False | False | False |
| 2 | chr2 | 20000 | 30000 | chr2 | False | 0.227998 | 3.0 | 0.400041 | 7.0 | 0.750755 | ... | 1.342230 | 47.0 | NaN | NaN | NaN | NaN | False | False | False | False |
| 3 | chr2 | 30000 | 40000 | chr2 | False | 0.055763 | 6.0 | 0.378382 | 12.0 | 0.756891 | ... | 1.338815 | 72.0 | NaN | NaN | NaN | NaN | False | False | False | False |
| 4 | chr2 | 40000 | 50000 | chr2 | False | 0.095784 | 6.0 | 0.194656 | 17.0 | 0.665099 | ... | 1.268551 | 97.0 | NaN | NaN | NaN | NaN | False | False | False | False |
5 rows × 21 columns
[6]:
windows
[6]:
[30000, 50000, 100000, 250000]
[7]:
df = insulation_table[
    [
        "chrom",
        "start",
        "end",
        "log2_insulation_score_30000",
        "log2_insulation_score_50000",
        "log2_insulation_score_100000",
        "log2_insulation_score_250000",
    ]
]
visualization of insulation#
[9]:
import trackc as tc
[15]:
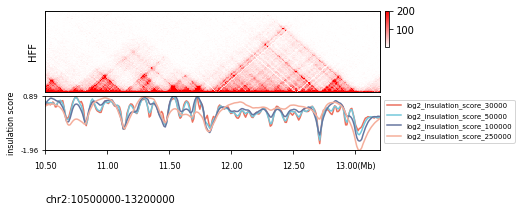
regions = "chr2:10500000-13200000"
HFF = tc.tl.extractCisContact(clr=coolfile, region=regions, extend=150)

ten = tc.tenon(figsize=(6, 1))
ten.add(pos="bottom", height=1.5, hspace=0.05)
ten.add(pos="bottom", height=1, hspace=0.07)

tc.pl.mapC(ax=ten.axs(0), mat=HFF, label="HFF", map_type="rec", height=150)

tc.pl.bdgmat_track(
    ax=ten.axs(1), bed=df, regions=regions, style="line", label="insulation score"
)
tc.pl.scale_track(
    ax=ten.axs(1),
    region=regions,
    scale_adjust="Mb",
    tick_pos="bottom",
    ratio2ax=1,
    space=0,
)

# tc.savefig('outfile.pdf')
no max min range
maxrange: 201.0 minrange: 1.0
color sizes less than plots, use defaults
bdg_mat minrange:-1.9644833979871403 maxrange:0.8863030621507203