Rearrangement Interactions#
In this section, we will show how to caption the figures in reproducing literature.
This is a research article published in Advanced Science (doi: 10.1002/advs.202200818), primarily investigating the structural variations and three-dimensional genomic interactions in pancreatic cancer. It is highly suitable for showcasing the multi-omics and multi-regions plotting capabilities of trackc.
Here is part of the Fig6 from that paper:


We will demonstrate the following features of TrackC:
Multi-omics and multi-region plotting:
TrackC can simultaneously plot multiple omics data (such as gene track, zoomin, ChIP signal, etc.) across multiple regions. This enables researchers to analyze the differences and interactions between different regions comprehensively.
Visualization of three-dimensional genomic interactions:
TrackC has the capability to visualize three-dimensional genomic interactions by plotting chromatin conformation data. This reveals the spatial organization and interactions between genes, aiding in understanding the complexity and functionality of gene regulatory networks.
Structural variation analysis:
TrackC provides structural variation analysis, detecting and visualizing genomic structural variations in cancer samples, such as chromosomal rearrangements, insertions, and deletions. This helps researchers understand the role of structural variations in the occurrence and development of cancer.
Data interactivity and export:
TrackC supports user interaction with the plotted charts and offers data export functionality for further analysis and sharing of research findings. By showcasing these features, we will demonstrate the value and potential applications of TrackC in cancer research.
Get test data#
Hi-C cool format matrix data
BxPC3 ChIP-seq data
[1]:
import cooler
import matplotlib.pyplot as plt
import pandas as pd
import pyBigWig

import trackc as tc

BxPC3_chr18_50k = cooler.Cooler(
    "../../trackc_data/examples/BxPC3.chr18.mcool::/resolutions/50000"
)
HPDE6C7_chr18_50k = cooler.Cooler(
    "../../trackc_data/examples/HPDE6C7.chr18.mcool::/resolutions/50000"
)
BxPC3_chr18_10k = cooler.Cooler(
    "../../trackc_data/examples/BxPC3.chr18.mcool::/resolutions/10000"
)
BxPC3_chr18_25k = cooler.Cooler(
    "../../trackc_data/examples/BxPC3.chr18.mcool::/resolutions/25000"
)
H3K27ac = pyBigWig.open("../../trackc_data/examples/GSM3178671_BxPC3_H3K27ac.bigwig")

full_regions = "18:45000000-78077248"
mark_regions = ["18:47340000-50370000", "18:61140000-63630000", "18:74030000-77560000"]
zoom_regions = ["18:47400000-48280000", "18:75280000-74030000"]
neo_domain_regions = ["18:47950000-48280000", "18:75280000-74850000"]

gene_bed12 = pd.read_table(
    "../../trackc_data/examples/hg19_chr18.bed12", sep="\t", header=None
)
gene_bed12[0] = gene_bed12[0].str.lstrip("chr")
display(gene_bed12.head(3))
| 0 | 1 | 2 | 3 | 4 | 5 | 6 | 7 | 8 | 9 | 10 | 11 | |
|---|---|---|---|---|---|---|---|---|---|---|---|---|
| 0 | 18 | 11103 | 16352 | LINC02564 | 0 | + | 16352 | 16352 | 0 | 5 | 492,205,470,202,735 | 11103,15617,11125,13152,15617 |
| 1 | 18 | 47221 | 49615 | TUBB8B | 0 | - | 49615 | 49615 | 0 | 6 | 1226,110,108,114,687,129 | 47221,48940,49129,49501,47928,48753 |
| 2 | 18 | 80140 | 88570 | IL9RP4 | 0 | - | 88570 | 88570 | 0 | 8 | 313,105,181,113,171,111,136,110 | 80140,84043,84729,85588,86111,86398,86930,88460 |
extract region contacts from cool
[2]:
norml = tc.tl.extractContactRegions(clr=HPDE6C7_chr18_50k, row_regions=full_regions)
tumor = tc.tl.extractContactRegions(clr=BxPC3_chr18_50k, row_regions=full_regions)
tumor_mark = tc.tl.extractContactRegions(clr=BxPC3_chr18_25k, row_regions=mark_regions)
tumor_zoom = tc.tl.extractContactRegions(clr=BxPC3_chr18_25k, row_regions=zoom_regions)
[3]:
display(tumor.row_regions)
| chrom | start | end | isReverse | fetch_start | fetch_end | region4coolFetch | cbins | |
|---|---|---|---|---|---|---|---|---|
| 18:45000000-78077248 | 18 | 45000000 | 78077248 | False | 45000000 | 78077248 | 18:45000000-78077248 | 662 |
[4]:
fig, ax = plt.subplots(1, 1, figsize=(5, 5))

tc.pl.mapC(
    mat2=tumor.cmat,
    ax=ax,
    map_type="square",
    cmap=tc.pa.fruitpunch,
    maxrange=70,
    minrange=1,
    symmetric=False,
)
tc.pl.mapc_markline(
    row_regions=tumor.row_regions,
    mark_regions=mark_regions,
    binsize=50000,
    ax=ax,
    map_order=1,
    symmetric=False,
    only_cis=False,
)

# fig.savefig('trackc_mark_rearrange2.pdf')
maxrange: 70 minrange: 1

multi regions
[5]:
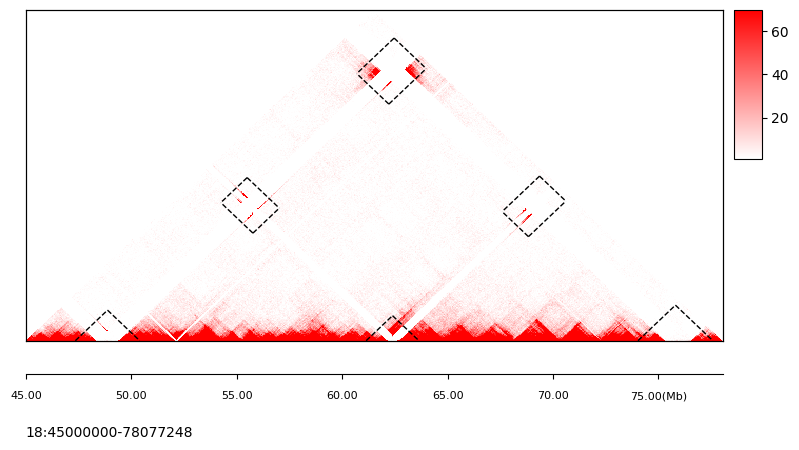
fig, ax = plt.subplots(1, 1, figsize=(9, 4.3))

tc.pl.mapC(
    ax=ax, mat=tumor.cmat, map_type="triangle", maxrange=70, minrange=1, symmetric=False
)
tc.pl.mapc_markline(
    row_regions=tumor.row_regions,
    map_type="triangle",
    mark_regions=mark_regions,
    binsize=50000,
    ax=ax,
    map_order=0,
    symmetric=False,
)

tc.pl.scale_track(
    ax, region=full_regions, scale_adjust="Mb", tick_pos="bottom", ratio2ax=0.2
)
maxrange: 70 minrange: 1
[6]:
full_regions
[6]:
'18:45000000-78077248'
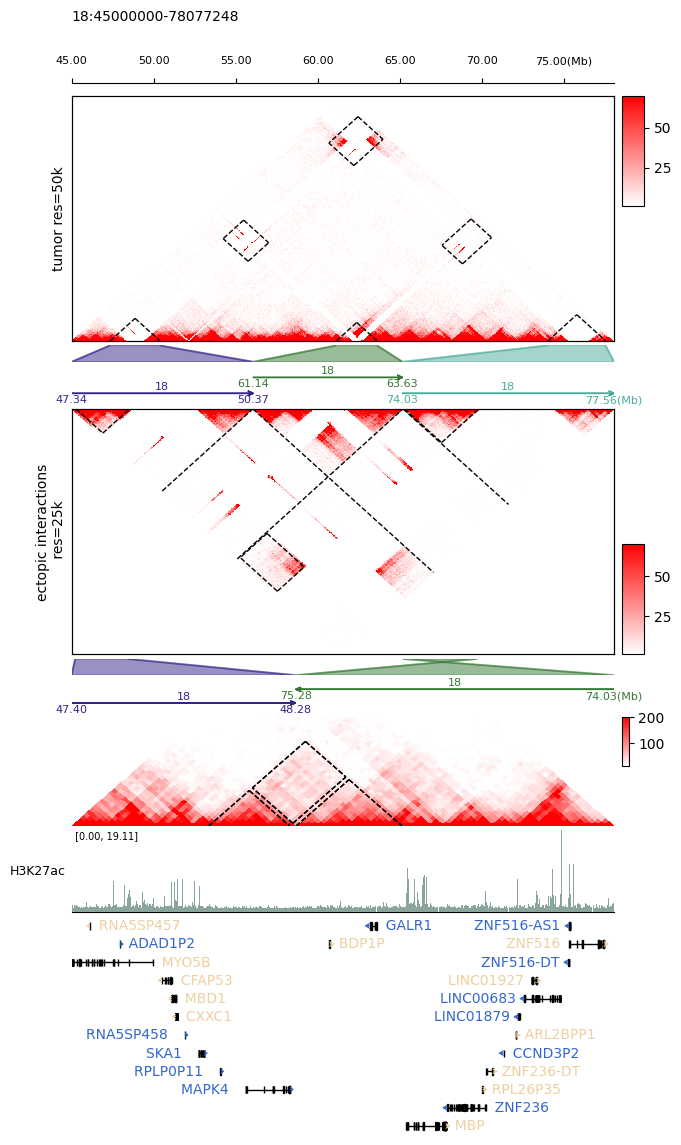
[7]:
fig, axs = tc.make_spec(
    figsize=(9, 9.5), height_ratios=[4.5, 0.3, 0.5, 4.5], hspace=0.04
)

tc.pl.scale_track(
    axs[0],
    region=full_regions,
    scale_adjust="Mb",
    tick_pos="top",
    ratio2ax=0.2,
    space=0.01,
)
tc.pl.mapC(
    mat=tumor.cmat,
    ax=axs[0],
    map_type="triangle",
    maxrange=70,
    minrange=1,
    symmetric=False,
    label="tumor res=50k",
)

tc.pl.mapc_markline(
    row_regions=tumor.row_regions,
    map_type="triangle",
    mark_regions=mark_regions,
    binsize=50000,
    ax=axs[0],
    map_order=0,
    symmetric=False,
)

tc.pl.zoomin(axs[1], [full_regions], mark_regions, line_on=True, fill=True, alpha=0.5)
tc.pl.multi_scale_track(
    axs[2], regions=mark_regions, scale_adjust="Mb", intervals=2, tick_rotation=0
)
tc.pl.mapC(
    mat2=tumor_mark.cmat,
    ax=axs[3],
    map_type="triangle",
    cmap=tc.pa.fruitpunch,
    maxrange=70,
    minrange=1,
    symmetric=False,
    label="ectopic interactions\n res=25k",
)

tc.pl.mapc_markline(
    row_regions=tumor_mark.row_regions,
    map_type="triangle",
    mark_regions=zoom_regions,
    binsize=25000,
    ax=axs[3],
    map_order=1,
    symmetric=False,
    show_regions_edge=True,
)


# fig.savefig('ectopic.pdf')
# plt.tight_layout()

# plt.savefig('ectopic.pdf', bbox_inches='tight')
maxrange: 70 minrange: 1
maxrange: 70 minrange: 1

[8]:
fig, axs = tc.make_spec(
    figsize=(7, 13.5),
    height_ratios=[4.5, 0.3, 0.7, 4.5, 0.3, 0.6, 2, 1.5, 4],
    hspace=0.04,
)

tc.pl.scale_track(
    axs[0],
    region=full_regions,
    scale_adjust="Mb",
    tick_pos="top",
    ratio2ax=0.3,
    space=0.05,
)
tc.pl.mapC(
    mat=tumor.cmat,
    ax=axs[0],
    map_type="tri",
    maxrange=70,
    minrange=1,
    symmetric=False,
    label="tumor res=50k",
)

tc.pl.mapc_markline(
    row_regions=tumor.row_regions,
    map_type="triangle",
    mark_regions=mark_regions,
    binsize=50000,
    ax=axs[0],
    map_order=0,
    symmetric=False,
)

tc.pl.zoomin(axs[1], [full_regions], mark_regions, line_on=True, fill=True, alpha=0.5)
tc.pl.multi_scale_track(
    axs[2], regions=mark_regions, scale_adjust="Mb", intervals=2, tick_rotation=0
)
tc.pl.mapC(
    mat2=tumor_mark.cmat,
    ax=axs[3],
    map_type="triangle",
    cmap=tc.pa.fruitpunch,
    maxrange=70,
    minrange=1,
    symmetric=False,
    label="ectopic interactions\n res=25k",
)

tc.pl.mapc_markline(
    row_regions=tumor_mark.row_regions,
    map_type="triangle",
    mark_regions=zoom_regions,
    binsize=25000,
    ax=axs[3],
    map_order=1,
    symmetric=False,
    show_regions_edge=True,
)

tc.pl.zoomin(axs[4], mark_regions, zoom_regions, line_on=True, fill=True, alpha=0.5)

tc.pl.multi_scale_track(
    axs[5], regions=zoom_regions, scale_adjust="Mb", intervals=2, tick_rotation=0
)


tc.pl.mapC(
    mat=tumor_zoom.cmat,
    ax=axs[6],
    map_type="triangle",
    maxrange=200,
    minrange=10,
    symmetric=False,
    label="tumor res=25k",
    ax_on=False,
    height=40,
)


tc.pl.mapc_markline(
    row_regions=tumor_zoom.row_regions,
    map_type="triangle",
    mark_regions=neo_domain_regions,
    binsize=25000,
    ax=axs[6],
    map_order=0,
    symmetric=False,
    show_regions_edge=False,
)

tc.pl.mapc_markline(
    row_regions=tumor_zoom.row_regions,
    map_type="triangle",
    mark_regions=neo_domain_regions,
    binsize=25000,
    ax=axs[6],
    map_order=0,
    symmetric=False,
    show_regions_edge=False,
)

tc.pl.bw_track(
    H3K27ac,
    ax=axs[7],
    regions=zoom_regions,
    label="H3K27ac",
    binsize=2000,
    primary_col="#8AA69C",
)

tc.pl.gene_track(
    ax=axs[8], bed12=gene_bed12, regions=zoom_regions, line=12, gene_fontsize=10
)
maxrange: 70 minrange: 1
maxrange: 70 minrange: 1
maxrange: 200 minrange: 10
quick layout
Before generating the plots, you can use the ten.show() function to quickly adjust the layout and ensure appropriate proportions between tracks.
ten = tc.tenon(figsize=(6,1))
ten.add(pos='bottom', height=0.6, hspace=0)
ten.add(pos='bottom', height=5, hspace=0.05)
ten.add(pos='bottom', height=1, hspace=0.05)
ten.add(pos='bottom', height=1, hspace=0.05)
ten.add(pos='bottom', height=1, hspace=0.05)
ten.add(pos='bottom', height=3, hspace=0.05)
ten.show()
[9]:
ten = tc.tenon(figsize=(6, 1))
ten.add(pos="bottom", height=6.5, hspace=0.05)
ten.add(pos="bottom", height=0.5, hspace=0.05)
ten.add(pos="bottom", height=0.3, hspace=0.05)
ten.add(pos="bottom", height=0.7, hspace=0.05)
ten.add(pos="bottom", height=1.4, hspace=0.05)
ten.add(pos="bottom", height=0.5, hspace=0.05)
ten.add(pos="bottom", height=3, hspace=0.05)

tc.pl.mapC(
    ax=ten.axs(0),
    mat=tumor.cmat,
    mat2=tumor_mark.cmat,
    map_type="squ",
    maxrange=70,
    minrange=1,
    cmap=[tc.pa.fruitpunch, "PuBu"],
    label=["ectopic interactions\nres=50k", "zoom in\nres=25k"],
)

tc.pl.mapc_markline(
    row_regions=tumor.row_regions,
    map_type="squ",
    mark_regions=mark_regions,
    binsize=50000,
    ax=ten.axs(0),
    map_order=0,
    symmetric=False,
)

tc.pl.mapc_markline(
    row_regions=tumor_mark.row_regions,
    map_type="squ",
    mark_regions=zoom_regions,
    binsize=25000,
    ax=ten.axs(0),
    map_order=1,
    symmetric=False,
    show_regions_edge=True,
)

tc.pl.scale_track(
    ten.axs(0),
    region=full_regions,
    scale_adjust="Mb",
    tick_pos="top",
    ratio2ax=0.1,
    space=0.01,
)


tc.pl.multi_scale_track(
    ten.axs(1), regions=mark_regions, scale_adjust="Mb", intervals=2, tick_rotation=0
)

tc.pl.zoomin(ten.axs(2), mark_regions, zoom_regions, line_on=True, fill=True, alpha=0.5)

tc.pl.multi_scale_track(
    ten.axs(3), regions=zoom_regions, scale_adjust="Mb", intervals=2, tick_rotation=0
)

tc.pl.mapC(
    ax=ten.axs(4),
    mat=tumor_zoom.cmat,
    map_type="triangle",
    maxrange=200,
    minrange=10,
    symmetric=False,
    label="tumor res=25k",
    ax_on=False,
    height=40,
)


tc.pl.mapc_markline(
    ax=ten.axs(4),
    row_regions=tumor_zoom.row_regions,
    map_type="triangle",
    mark_regions=neo_domain_regions,
    binsize=25000,
    map_order=0,
    symmetric=False,
    show_regions_edge=False,
)

tc.pl.bw_track(
    H3K27ac,
    ax=ten.axs(5),
    regions=zoom_regions,
    label="H3K27ac",
    binsize=2000,
    primary_col="#5B7695",
)

tc.pl.gene_track(
    ax=ten.axs(6),
    bed12=gene_bed12,
    regions=zoom_regions,
    track_type="gene",
    line=12,
    gene_fontsize=10,
)

# tc.savefig('trackc_rearrange-f.pdf')
maxrange: 70 minrange: 1
maxrange: 70 minrange: 1
maxrange: 200 minrange: 10
