Virtual4C#
Get test Data#
Hi-C#
https://www.ncbi.nlm.nih.gov/geo/query/acc.cgi?acc=GSM4604287
!wget https://www.ncbi.nlm.nih.gov/geo/download/?acc=GSM4604287&format=file&file=GSM4604287%5F1360%2Eiced%2Emcool
H3K27ac#
https://www.ncbi.nlm.nih.gov/geo/query/acc.cgi?acc=GSM4604189
!wget https://www.ncbi.nlm.nih.gov/geo/download/?acc=GSM4604189&format=file&file=GSM4604189%5F1360%5FCUT%5FTAG%5FH3K27ac%2EMACS2%2Enodup%5Fx%5Fctl%2Epval%2Esignal%2Ebigwig
[1]:
import cooler
import pandas as pd

import trackc as tc
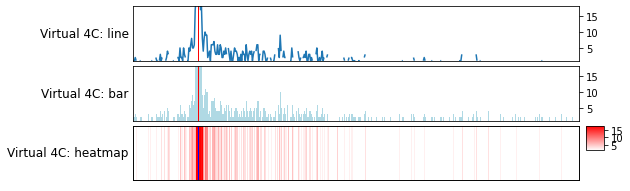
Virtual4C types#
Virtual4C support 3 visualization types
line
bar
heatmap
[2]:
# AML_1360 = cooler.Cooler('GSM4604287_1360.iced.mcool::/resolutions/10000')
AML_1360 = cooler.Cooler("../../trackc_data/tutorials/4C/GSM4604287_1360.sub.cool")

regions = ["chr8:127000000-129200000", "chr14:96500000-99300000"]
MYC_TSS = "chr8:127735434-127735435"

aml = tc.tl.extractContactRegions(clr=AML_1360, row_regions=regions)

ten = tc.tenon(figsize=(8, 1))
ten.add(pos="bottom", height=1, hspace=0.1)
ten.add(pos="bottom", height=1, hspace=0.1)
ten.add(pos="bottom", height=1, hspace=0.1)

tc.pl.virtual4C(
    ax=ten.axs(0),
    clr=AML_1360,
    target=MYC_TSS,
    regions=regions,
    track_type="line",
    label="Virtual 4C: line",
    target_color="r",
)

tc.pl.virtual4C(
    ax=ten.axs(1),
    clr=AML_1360,
    target=MYC_TSS,
    regions=regions,
    track_type="bar",
    label="Virtual 4C: bar",
    target_color="r",
    color="#B0D9E4",
)

aa = tc.pl.virtual4C(
    ax=ten.axs(2),
    clr=AML_1360,
    target=MYC_TSS,
    regions=regions,
    track_type="heatmap",
    label="Virtual 4C: heatmap",
    target_color="b",
)
no max min range
maxrange: 18.039999999999964 minrange: 1.0
no max min range
maxrange: 18.039999999999964 minrange: 1.0
no max min range
maxrange: 18.039999999999964 minrange: 1.0
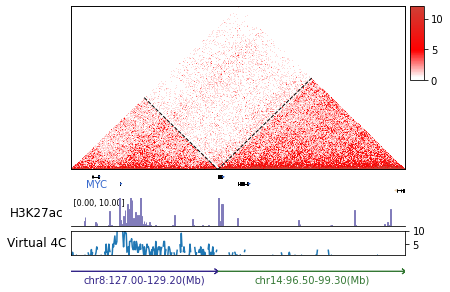
Virtual4C example#
Here is a Virtual4C and multi-omics figure from xu_subtype-specific_2022 Fig.4b

[ ]:
[3]:
gene_bed12 = pd.read_table(
    "../../trackc_data/tutorials/4C/Homo_sapiens.GRCh38.105.chr.bed13", header=None
)
gene_bed12 = gene_bed12[gene_bed12[12] == "protein_coding"]
gene_bed12[0] = "chr" + gene_bed12[0]

import pyBigWig

# AML_1360_H3K27ac = pyBigWig.open('GSM4604189_1360_CUT_TAG_H3K27ac.MACS2.nodup_x_ctl.pval.signal.bigwig')
AML_1360_H3K27ac = pyBigWig.open("../../trackc_data/tutorials/4C/GSM4604189_H3K27ac.bw")
[4]:
ten = tc.tenon(figsize=(6, 0.75))
ten.add(pos="bottom", height=4)
ten.add(pos="bottom", height=0.5, hspace=0.1)
ten.add(pos="bottom", height=0.7, hspace=0.1)
ten.add(pos="bottom", height=0.6, hspace=0.1)
ten.add(pos="bottom", height=0.6, hspace=0.1)

from matplotlib.colors import LinearSegmentedColormap, ListedColormap

fruitpunch3 = LinearSegmentedColormap.from_list(
    "fruitpunch3", [(0, "white"), (0.03, "w"), (0.4, "r"), (1, "#CF3F35")], N=100
)


aml = tc.tl.extractContactRegions(clr=AML_1360, row_regions=regions)
tc.pl.mapC(
    ax=ten.axs(0),
    mat=aml.cmat,
    maxrange=12,
    minrange=0,
    cmap=fruitpunch3,
    logdata=False,
    map_type="triangle",
    symmetric=False,
)
tc.pl.mapc_markline(
    ax=ten.axs(0),
    row_regions=aml.row_regions,
    map_type="triangle",
    binsize=20000,
    map_order=0,
    symmetric=False,
    show_regions_edge=True,
)

tc.pl.gene_track(
    ax=ten.axs(1),
    bed12=gene_bed12,
    regions=regions,
    line=3,
    gene_fontsize=10,
    show_label=["MYC"],
)
tc.pl.bw_track(
    AML_1360_H3K27ac,
    ten.axs(2),
    regions=regions,
    maxrange=10,
    label="H3K27ac",
    binsize=10000,
    invert_y=False,
)

tc.pl.virtual4C(
    ax=ten.axs(3),
    clr=AML_1360,
    target=MYC_TSS,
    regions=regions,
    maxrange=10,
    target_color="tab:red",
    track_type="line",
    label="Virtual 4C",
)

tc.pl.multi_scale_track(
    ten.axs(4),
    regions=regions,
    scale_adjust="Mb",
    intervals=1,
    tick_rotation=0,
    tick_fontsize=10,
)
# tc.savefig('trackc_v4c.pdf')
maxrange: 12 minrange: 0
maxrange: 10 minrange: 1.0