scale#
Trackc supports multi-regions scalebar. Trackc provides two scalebar methods:
trackc.pl.scale_track
trackc.pl.multi_scale_track
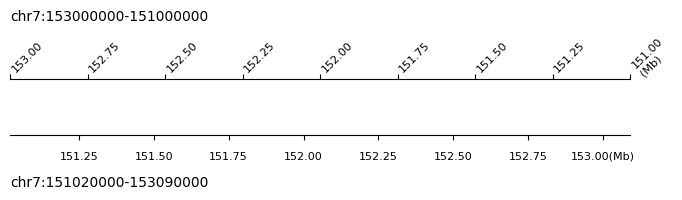
trackc.pl.scale_track#
scale_track method is for a single genome region ruler visualization, and reverse region visualization is also supported.
Refer to the section in the following code example:
tc.pl.scale_track(ax=ten.axs(0)...)
tc.pl.scale_track(ax=ten.axs(2)...)
ratio2ax parameter means the scalebar height relative to the ax parameter height
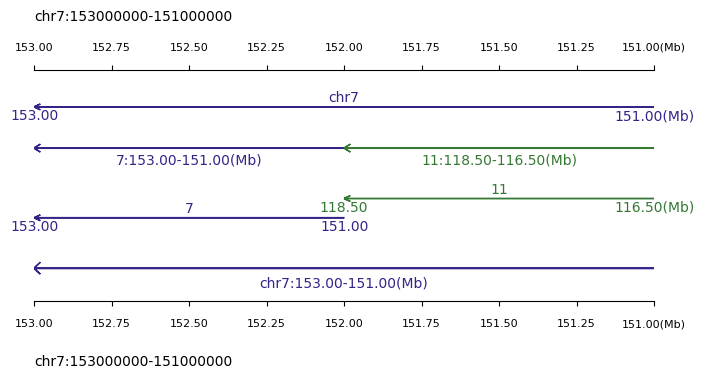
trackc.pl.multi_scale_track#
multi_scale_track method is designed for genome regions list ruler visualization, reverse region visualization is also supported. multi_scale_track method also support single genome region, just input the genome region in the form of list
For specific results, please see the following example
[1]:
import trackc as tc

region = "chr7:153000000-151000000"
region2 = "chr7:151020000-153090000"

ten = tc.tenon(figsize=(8, 1.2))
ten.add(pos="bottom", height=0.5)

ten.axs(0).axis("off")

tc.pl.scale_track(
    ax=ten.axs(0), region=region2, scale_adjust="Mb", tick_pos="bottom", ratio2ax=1.2
)
tc.pl.scale_track(
    ax=ten.axs(0),
    region=region,
    scale_adjust="Mb",
    tick_pos="top",
    ratio2ax=1.5,
    tick_rotation=45,
)
# tc.savefig('trackc_scale.pdf')
[2]:
region1 = "chr7:153000000-151000000"
region2 = ["chr7:153000000-151000000"]
regions = ["7:153000000-151000000", "11:118500000-116500000"]

ten = tc.tenon(figsize=(8, 1.2))
ten.add(pos="bottom", height=0.5)
ten.add(pos="bottom", height=0.4, hspace=0.1)
ten.add(pos="bottom", height=0.5, hspace=0.2)
ten.add(pos="bottom", height=0.6, hspace=0.1)

tc.pl.multi_scale_track(
    ten.axs(0), regions=region2, scale_adjust="Mb", intervals=2, tick_fontsize=10
)
tc.pl.multi_scale_track(
    ten.axs(1), regions=regions, scale_adjust="Mb", intervals=1, tick_fontsize=10
)
tc.pl.multi_scale_track(
    ten.axs(2), regions=regions, scale_adjust="Mb", intervals=2, tick_fontsize=10
)
tc.pl.multi_scale_track(
    ten.axs(3),
    regions=region1,
    scale_adjust="Mb",
    intervals=1,
    tick_rotation=0,
    tick_fontsize=10,
)

tc.pl.scale_track(
    ax=ten.axs(3), region=region1, scale_adjust="Mb", tick_pos="bottom", ratio2ax=1.2
)
tc.pl.scale_track(
    ax=ten.axs(0), region=region1, scale_adjust="Mb", tick_pos="top", ratio2ax=1.3
)

# tc.savefig('trackc_scale.pdf')