bedGraphMatrix#
[1]:
import pandas as pd

import trackc as tc
data#
[2]:
# cool
# HFF_MicroC.mcool: https://files.osf.io/v1/resources/hjcxg/providers/osfstorage/5f73756d9e9a3d03ec6e3922?action=download&direct&version=1
coolfile = "../../trackc_data/examples/HFF_MicroC.sub.cool"

# insulation score
df_bdgmat = pd.read_table(
    "../../trackc_data/tutorials/bedGraphMatrix/HFF_MicroC.chr2is.txt"
)
display(df_bdgmat.head(2))
| chrom | start | end | log2_insulation_score_30000 | log2_insulation_score_50000 | log2_insulation_score_100000 | log2_insulation_score_250000 | |
|---|---|---|---|---|---|---|---|
| 0 | chr2 | 0 | 10000 | NaN | NaN | NaN | NaN |
| 1 | chr2 | 10000 | 20000 | 0.431607 | 0.507928 | 0.682245 | 1.318723 |
visualization#
[3]:
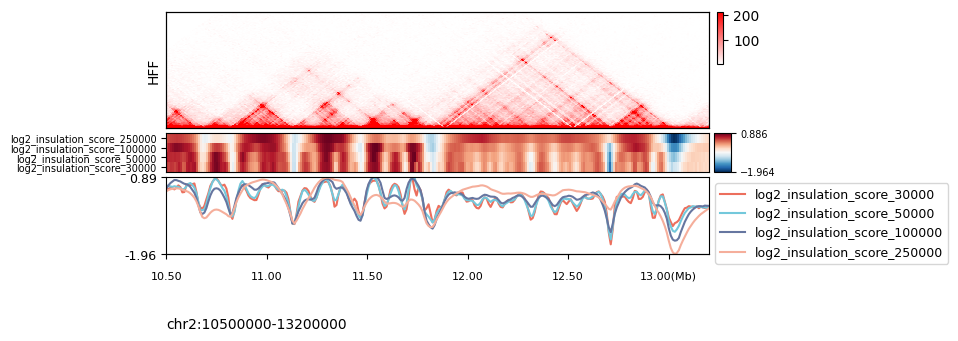
regions = "chr2:10500000-13200000"
HFF = tc.tl.extractCisContact(clr=coolfile, region=regions, extend=150)

ten = tc.tenon(figsize=(7, 1))
ten.add(pos="bottom", height=1.5, hspace=0.05)
ten.add(pos="bottom", height=0.5, hspace=0.07)
ten.add(pos="bottom", height=1, hspace=0.07)

tc.pl.mapC(ax=ten.axs(0), mat=HFF, label="HFF", map_type="rec", height=150)

tc.pl.bdgmat_track(ax=ten.axs(1), bed=df_bdgmat, regions=regions, cmap="RdBu_r")
tc.pl.bdgmat_track(
    ax=ten.axs(2), bed=df_bdgmat, regions=regions, style="line", tick_fontsize=9
)
tc.pl.scale_track(
    ax=ten.axs(2),
    region=regions,
    scale_adjust="Mb",
    tick_pos="bottom",
    ratio2ax=1,
    space=0,
)

# tc.savefig('outfile.pdf')
no max min range
maxrange: 211.0 minrange: 1.0
color sizes less than plots, use defaults
bdg_mat minrange:-1.9644833979871403 maxrange:0.8863030621507203